“The real food world happens as much in the back garden as it does on the hundred acre fields of potatoes … Unless we harness the skills and resources of gardeners as a serious part of our national food supply and integrate it into our whole approach to life, then the entire business of feeding ourselves healthily and economically, as well as the social and mental health of the nation will suffer...”- Monty Don, 2008 Lady Eve Balfour Memorial Lecture, Soil Association
Graduate School of the Environment School of Computing and Technology
Centre for Alternative Technology, University of East London
Machynlleth, Docklands Campus
Powys 4-6 University Way
SY20 9AZ London
UK E16 2RD
tel: 01654 705981 tel: 020 8223 3000
Tuesday 5 May 2009
Preface, Abstract, Acknowlegements
Preface
The purpose of this thesis was to research home-based food-growing in four neighbourhoods in Sheffield utilizing primary research carried out by the author.
The chief areas of interest were:
• comparisons of the extent of food-growing in each neighbourhood based on education, income, and community involvement and activism,
• reasons for growing or not growing,
• level of concern regarding threats to food security from peak oil, climate change, and resulting instability brought on by rising prices,
• types of support needed for growing efforts,
• the potential for resiliency in the promotion and support of home-based food-growing,
• additional issues such as soil contamination, allotments, and related behaviours such as organic food consumption, exercise, health impacts and money saving efforts.
Context was established with literature review and primary research was conducted using a Grounded Theory model.
Abstract
Using social research methods, including questionnaire, interview, and observation, four neighbourhoods in SW Sheffield were assessed to determine what factors are most likely to promote and support home-based food-growing. 68 questionnaires and 29 interviews were analysed. Each household interviewed was assessed for growing potential by measuring land area available, land area in food cultivation, solar resource, and availability of tools.
The hypotheses that emerged was that the group of people studied who grow food do not generally do so because they are concerned about food supply or to save money. They grow food primarily because they enjoy gardening, find it therapeutic and they want the freshest produce. They would appreciate access to more land to grow on but very few are interested in an allotment due to lack of proximity and time to adequately utilise one. Those who grow the most food are likely to have a university degree and be aware of threats to food security from peak oil and climate change. The most highly valued source of advice and training across the group are family members and other gardeners. Having a high level of personal community involvement and living within a neighbourhood that is active not only in growing but also socially is a key factor in the likelihood and/or the desire to grow food. The most successful growers live near and interact with other successful growers. Those who do not grow list lack of land and time as the primary reason, but the chances of growing are higher in neighbourhoods with more community involvement regardless of other factors.
Acknowledgments
Thanks to all who advised me and/or served on my peer review panel; Richard Clare, Anne Marie Culhane, Alaster Douglas, Heather Hunt, Dave Oxford, Maughan Pierce, Vanessa Senger, Jerry Simon, and Stephen Watts. Thanks to my thesis tutor Alison Pooley whose valued fortnightly advice kept me on track, to my thesis supervisor Melissa Taylor whose early encouragement insured perseverance, and to Bryony Benfield for her professionalism and reliability during my tenure at CAT. Thanks to Helen Sharma for putting in a good word for me when it counted and to Joan Randle for heeding it. Thanks to Graeme for advice, morale support and good cheer. Thanks especially to my wife Jacqui for giving me the time and support to do this degree, for transcribing the interviews, for her unbiased editing and proofing skills, and for encouraging me in the garden.
Table of Contents
Title page
Preface and Abstract
Acknowledgments
Contents
List of Abbreviations and Acronyms
List of Illustrations and Figures
Chapter 1 - Introduction, Literature Review and Context
Energy
Greenhouse Gas Emissions
Transport
Food Security
Bio Diversity
Health
Contamination
Urban Agriculture and the Developed World
Chapter 2 - Methodology And Method
Methodology
Method
The Questionnaire
Questionnaire Analysis Procedure
The Interviews
Interview Analysis Procedure
Chapter 3 – Primary Research
Neighbourhood Tenancy
Community Activism, Social Activities, and Resources
Neighbourhood #1
Neighbourhood #2
Neighbourhood #3
Neighbourhood #4
Land Use in the Neighbourhood
The Best Growers
Education, Climate Change and Peak Oil
Confidence
Income
Why Do They Grow?
Who Buys Organic Food and Why?
Citizen Detail #1
Local Food
What Do They Need to Grow?
Composting
Time
Age and Growing
Citizen Detail #2
Allotments
Project Details #1
Project Details #2
Soil Testing and Contamination
Chapter 4 – Analysis of Method
Questionnaire
Interview
Chapter 5 – Conclusions and Recommendations
Education, Climate Change and Peak Oil
Ownership, Land, and Activism
Food Security
Food Choices and Health
Motivation to Grow Food
What do they need to grow more?
Training
Composting and Allotments
Resilience and Policy
Contamination
Summary - A Better Way
Further Research Suggested
Bibliography and References
Appendices
#1 Glossary
#2 Research Diary sample
#3 Intro letter, Questionnaire, and Interview Request Letter
#4 Questionnaire Analysis Sample “Income”
#5 Questionnaire Analysis Sample “By Neighbourhood”
#6 Sample from Questionnaire Data Sheet
#7 Categorisation of Interview Questions and Responses
#8 Sample from Interview Analysis Document
#9 From the Sheffield City Council Website
#10 Boston Globe Contamination Article
#11 Chemical Cocktails
#12 Resource Pamphlet
List of Abbreviations and Acronyms
As – arsenic
Cd – cadmium
CLEA - Contaminated Land Exposure Assessment
Cr – chromium
CVD – Cardiovascular disease
DEFRA – Department for Environment, Food and Rural Affairs
ESRC - Economic and Social Research Council
FCRN – Food Climate Research Network
Fe – iron
FeS – iron sulphide
GHG – green house gas
LEAF – Local Enterprise Around Food
Ni – nickel
NVQ – National Vocational Qualification
Pb – lead
RHS – Royal Horticultural Society
RWH – rainwater harvesting
SASE – self addressed stamped envelope
So2 – sulphur dioxide
UA – urban agriculture
UEL – University of East London
VAT – value added tax
List of Charts, Illustrations and Figures
all charts and graphs are derived from my own data.
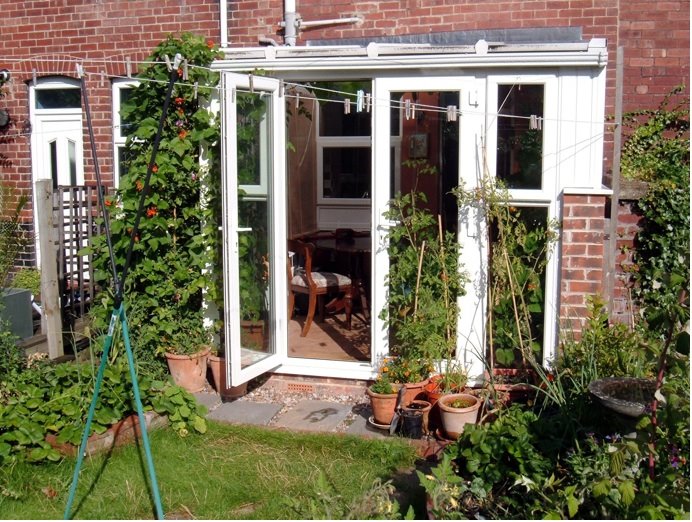
Photo - Sheffield back Garden
Chart #1 - Home Ownership
Chart #2 - Neighbourhood Comparison #1
Chart #3 - Neighbourhood Comparison #2
Chart #4 - How Many Grow What?
Chart #5 - How Many Grow How Much?
Chart #6 - Education of 14 Best Growers
Chart #7 - Mid or higher issues concerns
Chart #8 - Best Food Growers’ Food Choices
Chart #9 - Best Growers’ Income
Chart #10 - Confidence in Growing
Chart #11 - Money Saving Behaviours
Chart #12 - Income Distribution
Chart #13 - Income to Age
Chart #14 - Types of Food by Income
Chart #15 - Why They Grow
Chart #16 - Organic Perceptions
Chart #17 - How Many Buy How Much Organic?
Chart #18 - Local Food Purchased
Chart #19 - Why they do not grow
Chart #20 - Would Grow More If…
Chart #21 - Gardening Training
Chart #22 - Most valuable training resource
Chart #23 - Composters
Chart #24 - Free Compost delivered please
Chart #25 - Time Factors
Chart #26 - Fresh Cooking by Those in Need of More Time
Chart #27 - Meal Planning by Those in Need of More Time
Chart #28 - Types of Food Grown by Age
Chart #29 - Allotments
Chart #30 - Why No Allotments
Chart #31 - N1 and N4 comparison, allotment problems
Chapter 1 - Introduction, Literature Review and Context
A poll commissioned by the RHS in 2004 found,
“80% of the British population has access to a garden … of the 20% that don’t, half of them wish that they did … of those that had a garden only 2/3’s actively looked after it in any way and of that 2/3’s, less than half grow anything edible at all … the complaint was, from those that didn’t, is that they didn’t have time … but nevertheless they had time to work incredibly long hours to earn money to buy food, a third of which would be thrown away.” (Don 2008)
According to that survey only 20% of the British population grow food of any type.
Within living memory most of our food was grown locally and prepared in the family kitchen. Nowadays we have become almost completely dependent upon food supply chains spanning continents and oceans, using vast amounts of cheap fossil fuels. Food security depends not on our neighbours or fellow citizens but upon a tottering system of global finance and fossil fuel extraction.
As we increase our reliance on energy imports, so food grown or manufactured in this country will, relying as it does on energy inputs, be inherently import dependent. … measures to reduce the dependence of the food sector on energy inputs will … also increase food security.” (Garnett 2008 p.38)
Energy
If we look at just one staple crop, wheat, fossil fuels are used to manufacture and transport the agricultural chemicals involved, to harvest the crop, to dry the crop, to move the crop to processing facilities, to mill the crop, and to deliver the product. Even as far back as 1975, by the time the crop had been processed into a marketable product, procured and consumed, 37.6% of the energy embodied in a loaf of white bread had been expended on fertilisers and transport. (Chapman 1975 p.23)
More recent British and Dutch studies found the total amount of energy required and equivalent GHG emitted by the typical household for food consumption was roughly equal to energy use for all other household needs including the family car, a luxury also implicated in food chain emissions. (Vale 2000 Kramer K.J. et al., 1999 pgs.23-24)
“Emissions of CO2 from car journeys in the UK to purchase food rose by 27% between 1992 and 2002. They total about the same as those from heavy goods vehicles transporting food from mainland Europe.” (Millstone and Lang 2008 p.63)
Additionally, we are eating more foods out of season. A vegetable grown in a heated greenhouse requires 57 times more energy to produce than a vegetable grown in an open field. (Kol, Bieiot and Wilting 1993 p.28) In a world coping with peak oil this energy expenditure will become not only unaffordable but also unsustainable.
Such profligate energy use has implications far beyond food security.
Greenhouse Gas Emissions
As of 2007 the percentage breakdown of the approximately 18% of the UK GHG emissions attributable to food related activities is as follows;
5% - Fertilizer production
39% - Agriculture
6% - Transport from overseas
7% - UK transport
12% - Processing
5% - Packaging
5% - Retailing
8% - Catering
11% - Food preparation in the home
2% - Waste disposal
(Millstone and Lang 2008 p.63)
Refrigeration is not listed above but, as a necessary part of at least 5 of the above categories, is a major contributor,
“… the UK cold chain is responsible for something in the order of 15% of total food chain emissions.” (Garnett 2008 p.39)
Transport is involved in several of the above categories, not than just the two indicated, and is a significant contributor to emissions.
Transport
Between 1978 and 1999 the amount of food in transport in the UK increased by 16% while the miles traveled by food increased by 50%. (Paxton and Viljoen 2005 pgs.41-42) Research from September of 2008 published by the Food Climate Research Network indicates that air freighting of fruits and vegetables is particularly egregious,
“...while 1.5% of fruit and vegetables are carried by air, these foods account for 40% of all CO2 arising from fruit and vegetable transport.” (Garnett 2008 p.33)
If the UK switched to food produced entirely locally and organically it could reduce GHG emissions by 22% (Stanley 2002 p.25)
Additionally, as international transport increases due to globalisation, the infrastructure to support it helps to drive local enterprise out of business.
“The presence of new infrastructure makes it easier and cheaper to source from further afield and of course the cost of investment needs to be recouped. This fosters the continuation of, and increase in, long distance sourcing. By contrast, sources closer to home may be less economically attractive because labour costs are higher. … local enterprises go out of business, leaving no closer-to-home choice available.” (Garnett 2008 p.35)
This has negative impacts on local economic resilience.
Food Security
“Food security means that all people at all times should have physical and economic access to sufficient, affordable, safe and nutritious food necessary and appropriate for a healthy life, and the security of knowing that this access is sustainable in the future. … Addressing the problem may involve looking at income levels and the availability of refrigeration services, but also, Holben (2003, p161) argues, can be addressed at wider levels including participation in community gardens, learning about gardening, education on nutrition, food storage and preparation, and food safety education.” (Dowler et al. 2001 p.25)
The UK government acknowledges that many of its citizens have limited access to enough healthy food either due to low income or a paucity of retail establishments selling healthy options. (Tomkins 2006 p.27)
“And as new, urban lifestyles lead greater numbers of people to consume more fats and less fibre, more fast food and fewer home-cooked meals, … Urban and peri-urban agriculture can help improve food security in several ways: growing food at home or via a cooperative reduces the cost burden of acquiring food for the poor, puts more food within their reach, and reduces seasonal gaps in fresh produce.” (FAO 2005 p. 1)
The poor are not the only ones at risk. Even the more well off have become dependent upon supply chains spanning the globe for foods delivered out of season and none too fresh.
“Growing your own, it is argued, can protect a nation from the vagaries of economic and climatic conditions overseas. … is there a specific risk avoidance argument for shortening the supply chain?” (Garnett 2008 p.38)
While shortened supply chains can work to increase food security they can also decrease it, i.e., if a local populace is completely dependent upon food locally grown then it is at the mercy of climatic conditions and events. However, if it is totally reliant on foreign food it is at the mercy of problems anywhere along the supply chain. A position that reduces the risks inherent in both instances is called for. (Garnett 2008 p.38)
Bio Diversity
Industrial agriculture is reducing the bio diversity of our food supply through the loss of heirloom varieties of produce and seeds. In the US 97% of the original varieties of vegetables and fruit have been lost. Worldwide it is estimated that only 10% of the variety of crops that have been developed in the past are still being farmed. (Millstone and Lang 2008 pgs.38, 58) The UK has suffered as well,
“… over 12 years the average number of plant species in arable fields has fallen by 29%. Wildlife too is under threat and even cultivated crops are becoming more uniform. … There are … 2000 varieties of apple in the National Collection of the UK but today just nine dominate our commercial orchards.” (Raven et al. 1995 p.49)
The wider environment is also being degraded as we convert habitat to mono crop agriculture and pastureland worldwide. Ironically, where rural lands have been degraded by industrial agriculture, urban areas are sometimes havens for flora and fauna.
“… the urban environment is often already richer in flora and fauna than rural farm land; beehives in cities actually produce more honey than those in the country because cities are home to more trees and flowers than most parts of the modern countryside.”(National Federation of City Farms 1996 p.49)
Health
The UK suffers from over nutrition. 8% of men were considered obese in the 1980s, 22% were obese by 2005. For women, the number went from 9% to 24%. The situation is worse in the US. (Millstone and Lang 2008 pgs.26-29)
The developed world has undergone a nutrition transition characterized by,
“• a decline in the traditional staple foods … such as pulses and oilseeds
• an increase in intakes of fat, sugar, salt, and often animal foods
• an increase in alcohol consumption …
• an increase in the consumption of refined and processed foods
• an overall reduction in dietary diversity
Such changes in diet have an impact on health, leading to an increase in diet-related diseases, such as late-onset diabetes, some cancers and cardiovascular disease.” (Millstone and Lang 2008 p.82)
The nutritional quality of food marketed as “fresh” is declining due to the vagaries of the globalisation as well.
There is growing evidence that fresh seasonal food has significant health benefits. Local seasonal foods are consumed closer to their peak of ripeness, which increases the intake of health promoting phyto-chemicals found in the color and aromatic qualities of ripe produce. (Leitzmann 2005 p.758)
“Diets high in fresh fruit and salad vegetables appear protective against cancer and CVD. It is important to take into account the seasonality of consumption in estimating and establishing significance of risk.” (Cox et al. 1999 p.55)
Produce that is both fresh and seasonal can be hard to find, unless you grow it yourself and doing so is a healthy thing to do, in and of itself. Gardening as therapy was recognised in Sheffield by Dr. William Buchan in the 1760s. He observed better health and fitness in gardeners.
“‘… the very smell of the earth and fresh herbs revive and cheer the spirits, whilst the perpetual prospect of something coming to maturity delights and entertains the mind’.” (Buchan 1760 p.143)
Currently in Sheffield, Richard Clare, a local organic gardener and permaculture teacher runs a well attended social and therapeutic horticulture course on a yearly basis through the Sheffield Organic Food Initiative. (Clare 2008 p.1)
Contamination
Research was done on Sheffield city topsoils in 2005.
“A model of soil variability … was applied to 569 measurements of metal concentrations … in the topsoils of Sheffield … Each of the 35 spatial outliers that occurred in gardens have concentrations exceeding their Soil Guideline Value for residential land use with plant uptake, highlighting a potentially significant exposure pathway. … coal and furnace waste at these sites suggests that their dispersal … represents a significant point contaminant process. … Cr and Ni showed a significant association with disturbed sites … in part due to their prevalence in areas of historical steel manufacture. … Pb concentrations in urban topsoil … were twice the value in the rural environment … highlighting a very substantial diffuse Pb load to urban soils.” (Rawlins et al. 2005 p.353)
Sheffield has centuries of mining activity and steel works that has impacted the soil quality both through direct dumping of waste and airborne deposition of contaminants.
According to Richard Clare, “In the ‘70s in Sheffield due to industrial pollution, there was a public health recommendation not to grow food anywhere in the city.” (Worthington 2008)
Complicating the situation is the difficulty in getting reliable recommendations from soil testing. While there are laboratories to get contamination testing done,
“There are no widely available reference materials for bioaccessibility testing validated against human or appropriate animal in-vivo studies. … For lead, comparing in vitro data with human in vivo data indicated that the in vitro methods used by most of the laboratories in England and Wales underestimate bioaccessibility. … This is clearly a matter of concern if such test results are used to make decisions within the risk management of land contamination. (Barnes et al. 2007 p.67)
Part IIA of the Environmental Protection Act 1990 requires “… a science based risk assessment which takes account of toxicological information, and site specific … circumstances” to determine if significant possibility of significant harm (SPOSH) exists. The Act also “requires that local authorities identify contaminated land and ensure that significant risks are dealt with.” (Defra 2008 p.3) DEFRA published a software tool, the Contaminated Land Exposure Assessment (CLEA), to assist local authorities with this. The Act establishes to what degree remediation must occur primarily through a link to planning and development requirements.
The guidance provided by DEFRA is intended to assist local authorities, not the individual, with implementation of the Act. (Defra 2008 p.3) By leaving assessment of contamination primarily up to the planning process, are backyard gardens and existing allotment sites being overlooked? How does the homeowner or allotment holder gain access to CLEA tool for assessment of exposure on allotment sites? (COT 2008 p.1) My queries to the council to determine the extent of compliance have received no reply. See appendix #9 for details from the Sheffield City Council website regarding implementation of The Environmental Protection Act.
Research done by Dr. Rule, professor of biogeochemistry Loyola University, indicates that,
“Most soil contaminants will bind tightly to the soil particles and will move very slowly to the soil below.” (Rule 2008)
With the increasing interest in urban agriculture in Sheffield, are more of its’ citizens being exposed to existing, unmeasured, contamination of the soils?
“… vegetables, particularly leafy crops, grown in heavy metals contaminated soils have higher concentrations of heavy metals than those grown in uncontaminated soil. (Guttormsen et al. 1995; Dowdy and Larson 1995) A major pathway of soil contamination is through atmospheric deposition of heavy metals from point sources such as: metaliferous mining, smelting and industrial activities. … foliar uptake of atmospheric heavy metals emissions has also been identified as an important pathway of heavy metal contamination in vegetable crops. (Bassuk 1986; Salim et al. 1992)” (Kachenko and Singh 2004 p.1)
Given the lack of guidance for the individual citizen regarding the risks of food-growing in the city from soil contamination, as well as the evidence that there could very well be significant contamination, it seems prudent to apply the precautionary principle and assume that soils within Sheffield are guilty until proven innocent.
Urban Agriculture and the developed world
The food supply in Sheffield, like many western cities, is heavily dependent on cheap energy. With the onset of peak oil and the projected shifts in growing seasons and rainfall patterns due to climate change, the developed world could soon begin to resemble the developing world. Food security in urban areas will become more of an issue.
“In the ESRC Global Environmental Change Programme report (2001) the problem of food poverty in the UK ‘where 20 per cent of the population cannot afford healthy food especially where fuel and rent take priority’ is worthy of inclusion in a booklet about environmental justice.” (Sheriff 2005 p.35)
As fuel poverty increases, so too will food poverty.
Valuable lessons can be learned by the developed world about urban agriculture in the developing world. There are obvious similarities: land and labour are at a premium. Labour saving technologies to enhance intensification and verticalisation are called for. Land is likely to already be burdened with contamination and proximity to dense population makes use of agrochemicals especially dangerous. Preservation of the limited soil and water resources is of paramount concern.
“… we pay for our food three times: firstly at the shop, secondly through subsidies via our taxes and thirdly through the cost of clean up. In terms of water pollution, for example, UK water companies have had to spend £1 billion to filter pesticide residues out of drinking water (Lang and Heasman 2004, p224).” (Sheriff 2005 p.30)
Regulations will need to be drafted and enforced to ensure that urban agriculture doesn’t create additional health issues.
The differences between rural farming and urban agriculture (UA) mean that different approaches must be utilised when considering how best to plan for and implement strategies and policies to support UA. Urban populations are more heterogeneous than rural farming communities. Social networks are likely to play a more important role compared to technical knowledge. Food security is not the only issue; financial resilience can be enhanced as well. (RUAF 2001 p.76)
Just as on larger farms, income can be improved through the production and marketing of produce and value added products.
“One example of a successfully implemented strategy to enhance micro enterprise development in urban agriculture is the Brazilian initiative PROVE … a programme designed to promote and sustain small agricultural production, processing and trade involving several urban agricultural systems such as vegetable gardening, fruit production and livestock systems with low-income groups as the principal beneficiaries.” (RUAF 2001 p.56)
Policy makers and activists should plan for this type of development with policies dealing with access to land and credit, land tenure, market support, waste and hygiene, and training programmes. Production businesses foster processing business, as well as input and service delivery business. (RUAF 2001 p.52) Urban growers will have a better knowledge of the local markets and have less impacts and costs due to transportation than rural farmers. (RUAF 2001 p.46)
Chapter 2 - Methodology and Method
Methodology
At the time I was deciding on a thesis topic, peak oil and climate change were becoming more widely accepted as threats to our food supply. The issues of food crisis, food miles, and the carbon footprint of food were prominent in the media. Allotments are thoroughly researched but I found very little investigation of home-based food-growing. The majority of the population has no access to an allotment for one reason or another. I believe that more and more people will turn to growing in their own home gardens as the economy worsens.
On my own I was unlikely to get enough data to be statistically significant, therefore qualitative social research was required rather than a more quantitative approach. Because of the small sample group, I expected no more than for the data to point out relevant trends and issues. I knew little about the topic at the outset and needed the flexibility to alter my approach as I learned. I thought it more useful to discover the reality on the ground rather than formulating a hypothesis in advance and attempting to prove it. As Grounded Theory is designed for just such a situation I settled on that approach, utilizing questionnaires as well as interviews for data gathering.
“A grounded theory study seeks to generate a theory which relates to the particular situation forming the focus of the study. This theory is ‘grounded’ in data obtained during the study, particularly in the actions, interactions and processes of the people involved.” (Robson 2002 p.190)
Based on study of Robson’s Real World Research I decided to form an informal peer review panel and keep a research diary. (Robson 2002 p.1) The first entry is March 7th 2008 and the final entry is October 28th 2008. Many of the entries mirror the updates I sent to Alison Pooley, my thesis supervisor, every two weeks. See appendix #2.
I also consulted Gilham’s Developing a Questionnaire and The Research Interview during the formative stages of my research design and decided to triangulate my data through questionnaires, interviews, and direct observation. (Gilham 2007, 2004)
“Data triangulation … to enhance the rigour of the research … involves the use of more than one method of data collection.” (Robson 2002 p.174)
The returned questionnaires would inform the design of the interviews. I rejected a sample questionnaire due to time constraints and instead planned follow-up telephone interviews if required.
While the SW side of Sheffield is home to affluent ethnically homogenous neighbourhoods it also contains both ethnically and financially diverse neighbourhoods. To ensure a level of diversity across and within the groups and thus increase the relevance of the research, I picked four very different sample neighbourhoods.
Initially, I hoped to not only learn about home growing but also to be instrumental in promoting and supporting growers in some way. Options for financing support was only available for one neighbourhood so I discarded this idea other than to provide a list of resources to all who returned the questionnaire and wished further contact. See appendix #12. I also rejected assessing yields from active growers, as it was not likely to give me data that would be comparable to other growers due to the heterogenous nature of the sample group. It would also be misleading in terms of food security or health of diet, as I would not be following the produce to table or doing a study on household diet.
Method
My peer review panel consisted of a professional psychologist, several professional activists, the most prominent food grower in Sheffield, several activist amateur growers, and a doctoral student at Oxford. We discussed, separately and in groups, home-based food-growing and factors that might be involved in its promotion and support as well as social research technique. Advice regarding social research texts, questionnaire design, neighbourhoods of interest, and the activities of organisations and activists centered on food in the Sheffield area was gratefully received. I practised my interview technique, using a laptop and USB microphone, by recording and transcribing several of the individual discussions.
The Questionnaire
After careful consideration of the issues I believed to be most pertinent, I formulated a set of preliminary closed questions and began with the layout, keeping it brief and simple, avoiding jargon and technical terms or too great a reliance on opinion based responses. (Gilham 2007 p.26) I created a questionnaire divided into 6 sections, each with 3 to 6 questions; Demographics, Environmental/Resource Concerns, Household Practises, Gardening, Personal Health and Other Factors. The 5 Environmental/Resource Concerns questions are the only ones that are belief or opinion based. I used pre-selected scaled responses to facilitate analysis.
Each of the 136 questionnaires included a letter of introduction explaining my research as well as a SASE to ensure its return. I personally delivered 95% of them to households by knocking on doors. Except for 7 questionnaires delivered by friends I never left a questionnaire without talking to the resident. Expecting no better than 30% return, I was delighted to receive 50% back. See appendix #3.
Questionnaire Analysis Procedure
I intended to set up a spreadsheet for one question at a time beginning with income. All responses were sorted by income and neighbourhood. See appendix #4. Upon completion I realised that due to 9 recipients choosing not to answer the income question on the survey, the data on this spreadsheet was useless except for analyzing factors correlating to income alone. I therefore created spreadsheets that produced totals for each response in each neighbourhood but these proved too cumbersome for determining correlations between factors. See appendix #5.
At this point I considered using statistical analysis software. My supervisor, Alison Pooley procured some statistical software for me to try out. After spending two days sourcing a PC, reformatting it, and loading windows and the software, I discovered the activation key for the software that had been provided had expired and I was faced with trying to get another one from UEL. I had already lost time on this and I decided not to pursue it any further as I had little faith in getting it up and running expediently. Had I been familiar with this resource prior to starting on my questionnaire design I believe I could have made good use of it. Instead, I was left to hand count and correlate responses.
For example, I separated the surveys based on what food types each household grew. I would then go through each pile looking for high numbers of responses to other questions. I discovered, for instance, that all but 1 of the respondents growing all 4 food types have a first degree or higher educational qualification. I further subdivided the groups looking for well-educated growers who grow the most who also expressed a high degree of concern for climate change. I did this for every question. All these numbers were recorded on a data sheet that grew to 44 pages. See appendix #6. In compiling the thesis, I used the spreadsheets and data sheets to assemble charts.
The Interviews
Anyone returning a questionnaire and expressing a willingness to participate in further research was contacted again. See appendix #3. The majority of them agreed to be interviewed. Only 3 either later cancelled or did not show up. I compiled a set of questions that complemented the questionnaire and then customised each interview based on personal responses. For example, I did not ask interviewee 13 what prevented him from getting an allotment because he indicated he had an allotment. 29 interviews were completed. Most interviews occurred in the their homes where I also measured the gardens, assessed solar resource, and noted gardening infrastructure. Interviews were recorded and all interview responses were transcribed onto the question sheet produced for the interview.
Interview Analysis Procedure
I grouped the questions into categories. I then grouped relevant interview questions under the category. For example,
Category A. Involvement in community
How long have you lived in this neighbourhood?
How well do you know your neighbours? any that grow food?
Are you familiar with any neighbourhood community activism since you have lived here?
Would you participate in neighbourhood growing?
Would you be interested in gardening in someone else’s yard?
Would you allow others to grow food in your garden?
See appendix #7. Next, I copied the answers to each question from the text of the transcriptions into the analysis document being careful to label each response with the interview number and color code by neighbourhood. See appendix #8.
By picking key concepts mentioned in the responses and counting the number of times a respondent used language relating to that concept I found and charted trends.
For example, the level of community activism known about and/or participated in varied drastically from neighbourhood to neighbourhood. I established an index of community activism based on key words given in the interviews. I did the same for social activities. I listed key words and indicated the percentage of the interviewees in each neighbourhood who mentioned either a word or a concept that implied neighborhood social activities. For instance, when one individual mentioned a “new mums” group and another mentioned ”Sure Start” I put a 1 next to parents/kids in the list. Similarly, I put a 1 next to community whenever an individual used that word or mentioned an organisation that is about community building; I only indicated one tick per category per person. If no-one in N#1 ever mentioned a category that someone else in another neighbourhood did, then N#1 received a 0 for that category. I converted these numbers to percentages; if a neighbourhood had 2 mentions of a category out of 5 total interviews they received 40% for the category. Averaging the percentages, including all the percentages for unmentioned categories, delivered a number to be used for comparison. For instance, N#1 received a 19% score for community activism, which is the highest of all four neighbourhoods, while it scored 21% for social activities. N#4 scored 9% for community activism while it scored 22% for social activities. While these scores seem low, N#4 is actually the most socially active. A neighbourhood could only receive a 100% score if every person interviewed mentioned every category. So the numbers are only relevant as comparisons between neighbourhoods.
Subscribe to:
Posts (Atom)